
7.1 Pools, fluxes, and primary production #
7.1.1 The accounting #
Tansley named the system. Lindeman made energy the currency. A pool is a quantity: grams of carbon in leaves, or in soil. A flux is a rate: grams per square metre per year. Standing crop is not production. Wood is a large pool with a modest flux. Phytoplankton are a small pool with a large flux. Residence time, when a pool is near steady state, is the pool divided by the output flux. A budget balances: inputs equal outputs plus the change in storage. A study that cannot close the budget has found a missing term. That is a result.
| Symbol | What is subtracted | What it answers |
|---|---|---|
| GPP | Nothing; it is carbon fixed by autotrophs | How much photosynthesis occurred |
| NPP | Autotroph respiration: NPP = GPP − R_a | New plant (or algal) biomass available to others |
| NEP | All ecosystem respiration: NEP = GPP − R_e, which equals NPP − R_h | Whether the ecosystem is storing carbon |
R_h is heterotroph respiration. A mature forest can have a high NPP and a near-zero NEP if decomposition matches production. Net ecosystem exchange is the atmospheric measurement, often from a flux tower. It is nearly the same quantity as NEP with the opposite sign convention, and the tower misses some lateral fluxes and some disturbances. The method is part of the number. Harvest methods miss what herbivores removed and what roots exuded, unless those are estimated.
Units are grams of dry mass, or grams of carbon, per square metre per year. Carbon is about half of plant dry mass, and the fraction varies. A figure in dry mass is not numerically the same as a figure in carbon.
7.1.2 Where production is high, and what limits it #
NPP per unit area is high where it is warm, wet, and not starved of nutrients. Tropical forests are at the high end on land. Deserts and tundra are at the low end. Open-ocean gyres are low per unit area. Upwellings, coasts, and some high-latitude seas are higher per unit area. Whittaker’s classic compilation is the source of the orders of magnitude still used in teaching. Later satellite estimates revise the values and keep the ranking. These notes do not quote a measured NPP for a named stand.
Because the ocean is large, global marine NPP is of the same order as global terrestrial NPP. Each is about 50 petagrams of carbon a year, and the estimate depends on the method. A petagram is 10^15 grams, a billion tonnes. Agricultural systems can be high in NPP and can export a large fraction of it. The export is a flux out of the local budget, which is why a harvested field is not a natural steady state.
Limits differ by system. Terrestrial NPP is widely limited by water and by nitrogen, with phosphorus important on old tropical soils and in some grasslands. Fresh waters are often limited by phosphorus. Marine production is often limited by nitrogen or by iron. High-nutrient, low-chlorophyll regions, including parts of the Southern Ocean, the equatorial Pacific, and the subarctic Pacific, have unused nitrogen and phosphorus and little phytoplankton. Small experimental additions of iron have raised chlorophyll there. That is evidence about limitation. It is not a plan for fertilising an ocean, and these notes give no dose and no deployment.
Colimitation is common, so Liebig’s single factor is again only the first cut. Light limits the understorey and the deep water even when the ecosystem as a whole is nutrient-limited. The compensation point, where photosynthesis balances the producer’s respiration, is a property of an individual or a layer. The photic-zone rule of thumb from Chapter 2 is the ecosystem-scale version.
7.1.3 Secondary production and the 10% teaching number #
Ingestion I is what a heterotroph eats. Assimilation A is I minus what is egested. Production P is A minus respiration. Assimilation efficiency A/I is higher for carnivores than for herbivores eating fibrous plants, and higher for a diet of seeds, nectar, or flesh than for a diet of wood. Production efficiency P/A is often higher in ectotherms than in endotherms, because the endotherm spends assimilation on heat. Trophic efficiency, sometimes called Lindeman efficiency, is production at one level divided by production at the level below. It is often on the order of about 10%, often lower for endotherms, and sometimes higher in aquatic grazing chains. Ten per cent is a teaching round number. It is not a constant of nature. Lindeman’s own efficiencies varied.
Most terrestrial NPP is not eaten by herbivores. It dies and enters the detrital channel. A green food web, based on living plants, and a brown food web, based on detritus, are both required. In many terrestrial systems the brown web carries more of the energy. An account that follows only “plant, herbivore, carnivore” has dropped most of the flux.
7.2 Why chains are short, and why energy does not cycle #
Each transfer loses usable energy as heat. The biochemical bookkeeping is Biochemistry. The consequence is ecological. Little production remains after a few transfers, so food chains are usually short, often three or four links from the autotroph to a top consumer. Length is also set by body size, by the stability of the interaction, and by disturbance. Pimm and Lawton argued that efficiency is not the only constraint. The microbial loop in the sea (Chapter 9) adds links and dissipates energy before it reaches fish, which is an efficiency story and a structure story at once.
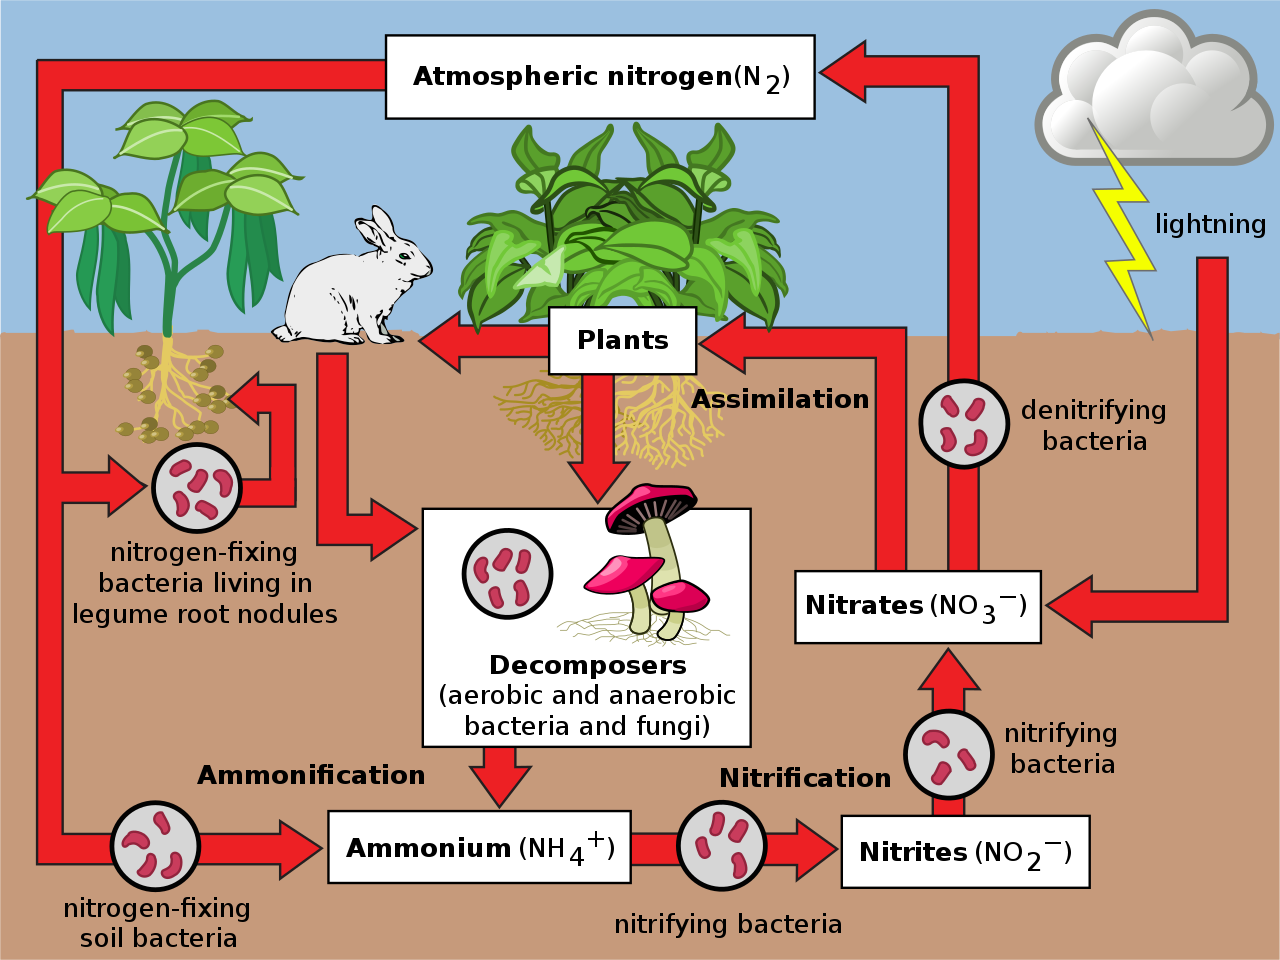
Nitrogen Cycle 2
Energy enters as solar radiation, is stored briefly in chemical bonds, and leaves as heat. It does not return to light. A diagram that draws energy as a closed cycle is wrong. Nutrients cycle because an atom of nitrogen is still nitrogen after it has been ammonium, protein, and nitrate. The contrast between a flow of energy and a cycle of matter is the reason Chapter 8 is a separate chapter and not a reprint of this one.
The biosphere is not an organism with a metabolism planned to keep itself comfortable. Lovelock’s Gaia hypothesis proposed that life regulates the planetary environment in its own interest. Daisyworld is a model in which dark and light daisies, by changing albedo, can stabilise temperature under some assumptions. Feedbacks between life and climate are real and are discussed in Chapters 8 and 10. They do not make the Earth a selected superorganism. There is no evidence of a planetary physiology that optimises for life in general. Local feedbacks have signs, positive and negative, and the signs are empirical.

Carbon Cycle-Cute Ar
7.3 Decomposition #
7.3.1 Who does it #
Fungi and bacteria mineralise most of the detritus. Detritivorous animals fragment litter, graze the microbes, and move material. Their own assimilation of the litter is often modest beside the microbes’. The identities and the biochemistry are Microbiology, including lignin degradation by fungi and the syntrophy of fermenters and methanogens in anoxic mud. Three physical and chemical processes run together: leaching of soluble compounds, fragmentation, and catabolism.
7.3.2 What sets the rate #
Temperature speeds chemical attack until conditions are otherwise hostile. Moisture has an optimum. Very dry litter hardly decomposes. Waterlogged, anoxic peat hardly decomposes aerobically and can store carbon for millennia. Litter quality is the third control. A high ratio of carbon to nitrogen, a high lignin content, and tannins slow decomposition. Nitrogen-rich litter decomposes faster and can mineralise nitrogen, releasing inorganic nitrogen. Carbon-rich litter can immobilise nitrogen, locking it into microbial biomass until the excess carbon is respired. A C:N ratio often cited near 25 is a rough divide between net mineralisation and net immobilisation, and it depends on whether the carbon is labile or recalcitrant. It is not a universal constant.
7.3.3 Stores that depend on slow decomposition #
Peat, permafrost soils, and coastal sediments under mangroves, salt marshes, and seagrasses hold carbon because decomposition is slow, not because production is uniquely high in every case. Circumpolar soils hold a very large stock, well over a thousand petagrams of carbon, the figure depending on the depth included. That stock is large beside the annual fossil-fuel flux of Chapter 8. Whether warming and drying move it into the atmosphere is a feedback in Chapter 10. These notes do not invent a release schedule.
7.4 Stoichiometry connects this chapter to the cycles #
Organisms differ in their ratios of carbon, nitrogen, and phosphorus. The Redfield ratio, about 106 C : 16 N : 1 P by atoms, describes an average for marine plankton. It is not a formula for every cell or every leaf. A consumer whose body is richer in nitrogen or phosphorus than its food must eat more carbon than it keeps, and it releases the excess. Microbes decomposing carbon-rich litter do the reverse: they take inorganic nitrogen from the soil. Sterner and Elser’s ecological stoichiometry is this matching of ratios. It is why a carbon budget and a nitrogen budget cannot be drawn as if they were independent, which is the opening point of Chapter 8.

Carbon Cycle-Cute -No
Key terms. Pool; flux; GPP; NPP; NEP; trophic efficiency; detrital channel; mineralisation; immobilisation; Redfield ratio; residence time.
Summary. Production is a flux. GPP is fixation, NPP subtracts the autotroph’s respiration, and NEP subtracts heterotroph respiration as well, so a productive forest can store nothing if decay matches growth. Global land and ocean NPP are each about 50 petagrams of carbon a year, with deserts and gyres low per area and forests and upwellings high. Trophic efficiencies are often near a tenth and are not fixed there. Most land production enters detritus. Energy flows through and leaves as heat. Elements cycle. Decomposition rate is temperature, moisture, and litter quality, and the large soil and peat stores exist because that rate can be very low. Redfield stoichiometry is an average for marine plankton and a reminder that the cycles are coupled.
Self-check.
1. A forest’s NPP is large and its NEP is about zero. What is happening to the carbon fixed this year?
2. Why is a pyramid of energy unable to invert, in terms of this chapter’s accounting rather than as a slogan?
3. Why do these notes refuse to treat 10% as a constant trophic efficiency?
4. A litter has a very high C:N ratio. Will soil inorganic nitrogen tend to rise or fall in the short term, and why?
5. What is the Redfield ratio a description of, and what mistake does treating it as a universal cell formula produce?

