
 SVG
SVGBiomes Of The World
Evolutionary mechanisms and ecological trophic dynamics structure biodiversity across spatial and temporal scales.
 SVG
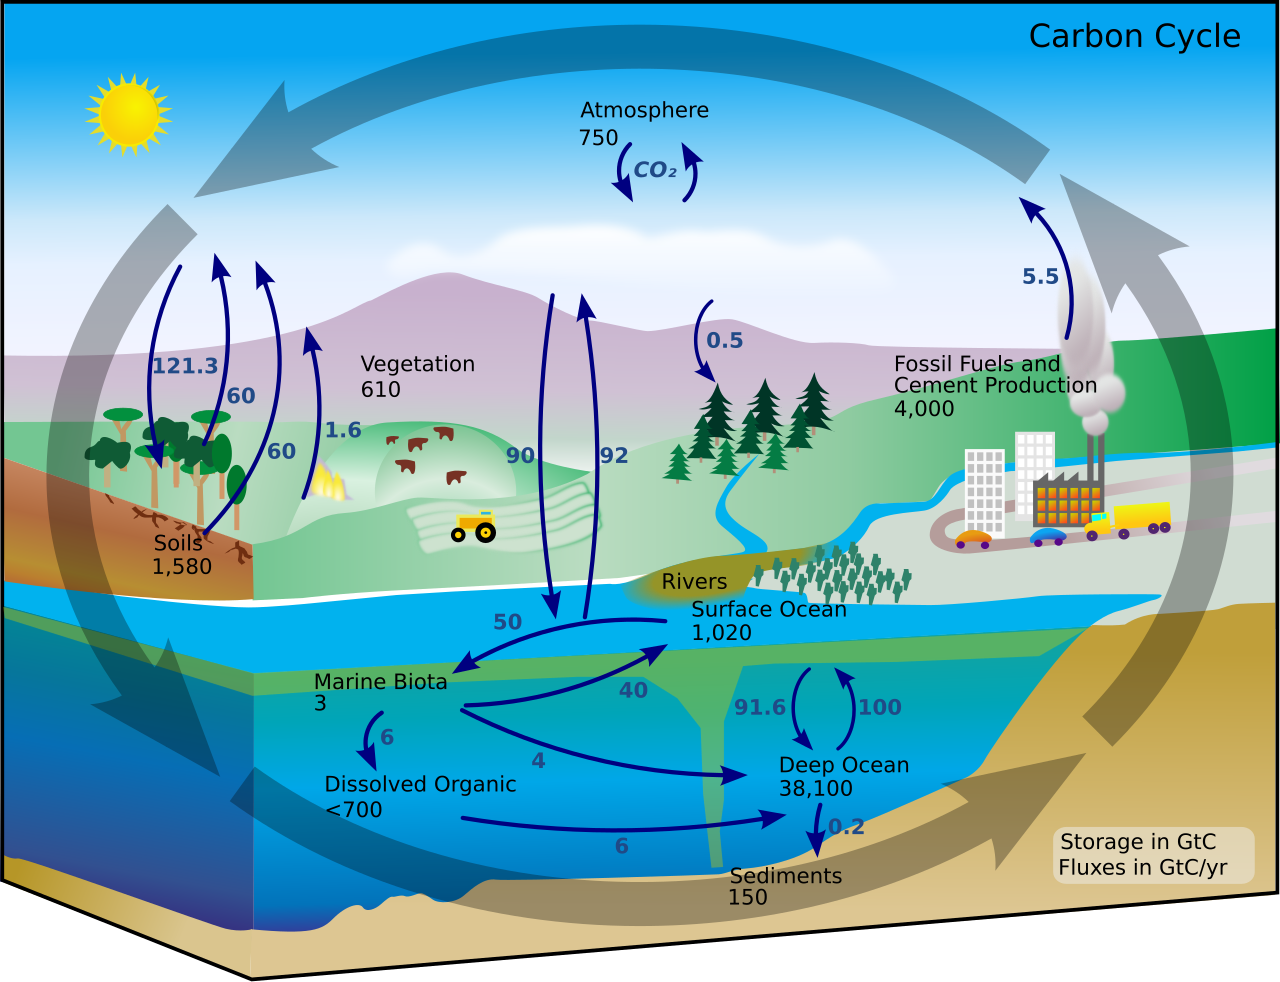
SVGCarbon Cycle Cute
This carbon cycle diagram shows the storage and annual exchange of carbon between the atmosphere, hydrosphere and geosphere in gigatons - or billions of tons - of Carbon (GtC). Burning fossil fuels by people adds about 5.5 GtC of carbon per year into the atmosphere.
 SVG
SVGEcological Pyramid
A generic ecological or trophic pyramid, which shows the flow of food energy upwards through an ecosystem.
 SVG
SVGFood Web
a simple food web representing sea, earth and air animals. based mainly on the information found on http://www.fcps.edu about the ecology on islandcreeks. image created on cooperation with the CK-12 project
 SVG
SVGLogistic Carrying Capacity
Figure 1 shows the growth of a population following a logistic curve, resulting in the S-shaped graph. This model reaches a stable equilibrium, sustaining the population at the carrying capacity as time continues.
 SVG
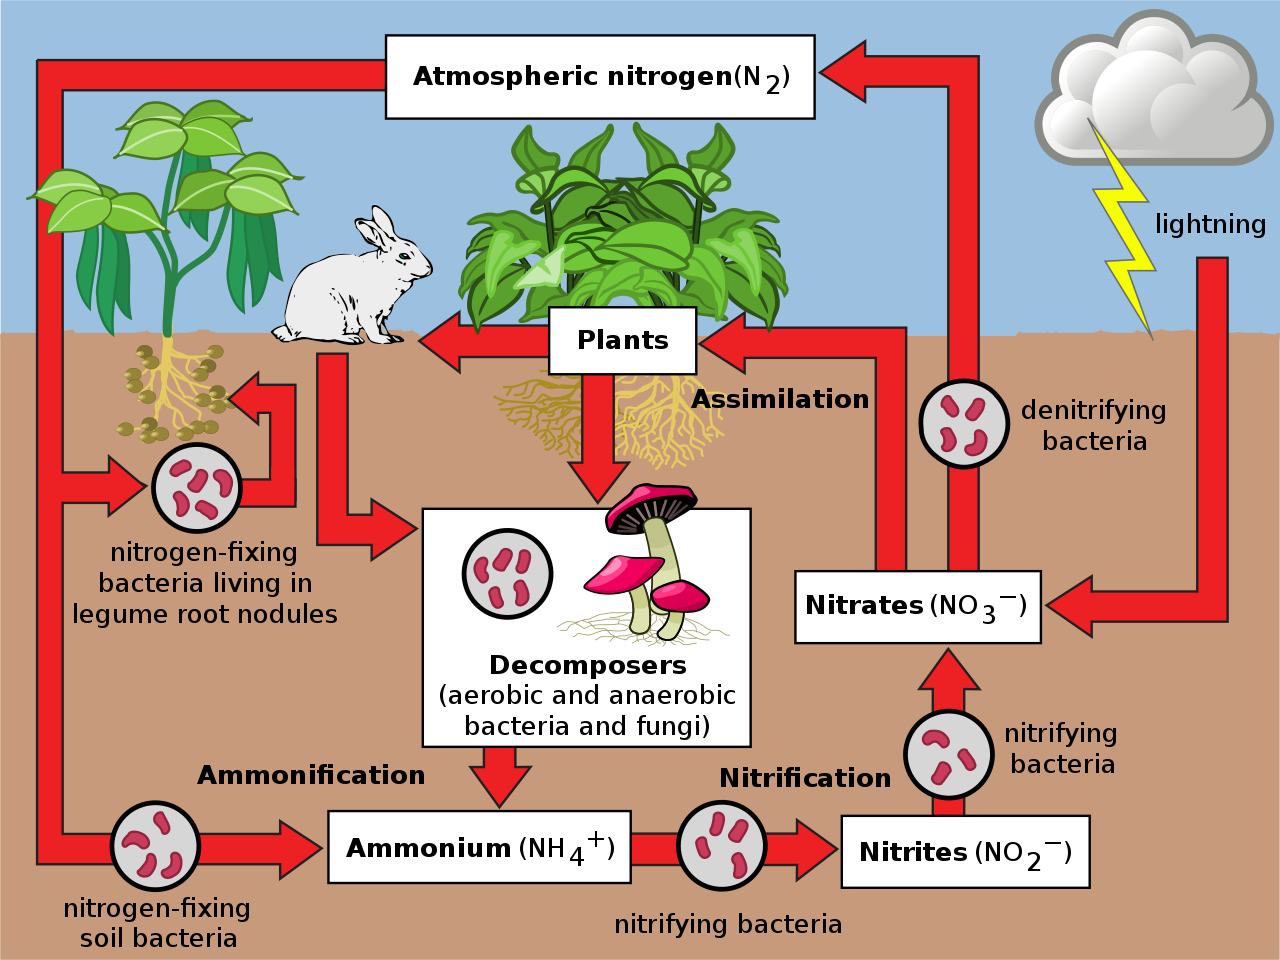
SVGNitrogen Cycle 2
Evolutionary mechanisms and ecological trophic dynamics structure biodiversity across spatial and temporal scales.
 SVG
SVGForeign Born Population Pyramid In 2021 In England And Wales By 5 Year Age Structure
Foreign born population pyramid in 2021 in England and Wales by 5 year age structure
 SVG
SVGLondon Population Pyramid 1971
This detailed scientific diagram illustrates London Population Pyramid 1971 in the context of Ecology.
 SVG
SVGCarbon Cycle-Cute -No
Evolutionary mechanisms and ecological trophic dynamics structure biodiversity across spatial and temporal scales.
 SVG
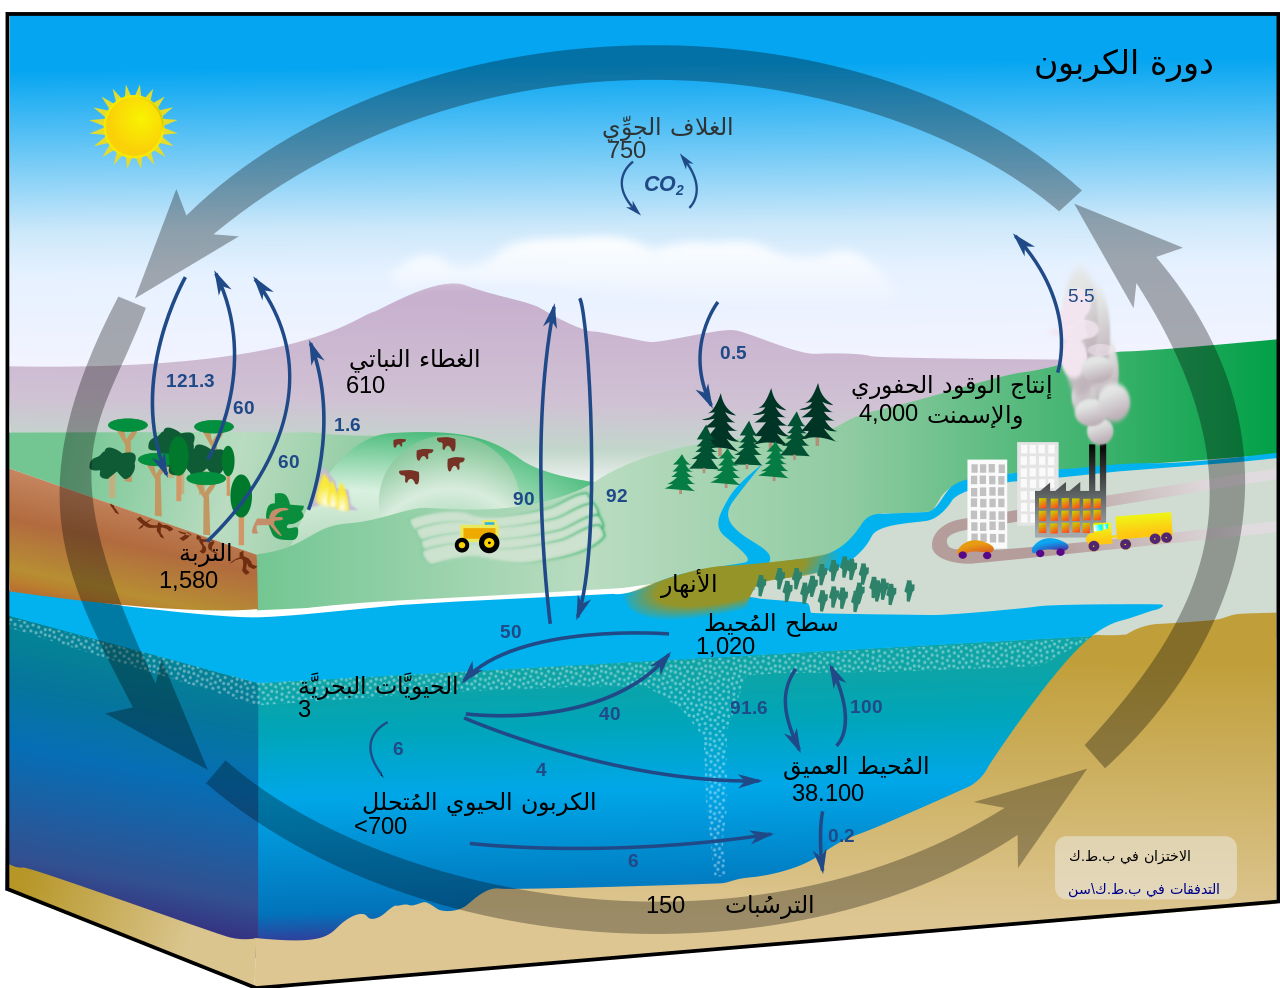
SVGCarbon Cycle-Cute Ar
هذا الرسم البياني عن دورة الكربون يُظهرُ المخزون والتبادل السنوي للكربون بين غلاف الأرض الجوّي ، و الغلاف المائي والغلاف الأرضي بالجيجاطن- أو بلايين الأطنان- للانبعاث الكربوني (GtC). يُضيف حرق الوقود الأُحفوري من قِبل البشر حوالي 5.5 GtC من الكربون في السنة إلى الغلاف الجوي.
 SVG
SVGNitrogen Cycle-Cy
Authoritative scientific diagram illustrating Nitrogen Cycle-cy with academic labeling and conceptual fidelity.
 SVG
SVGNitrogen Cycle - Reactions And Enzymes Mk
The reactions and respective enzymes involved in the biogeochemical nitrogen cycle. Labels in Macedonian.
 PNG
PNGMore Omnivore Top Predator Foodweb
component 5, or the top predator, presents a standard deviation of 1.4 TL (trophic levels), a somehow higher level of omnivory
 PNG
PNGSimplified Microbial Food Web In The Sunlit Ocean
Simplified microbial food web in the sunlit ocean. Left side: classic description of the carbon flow from photosynthetic algae to grazers and higher trophic levels in the food chain. Right side: microbial loop, with bacteria using dissolved organic carbon to gain biomass, which then re-enters the classic carbon flow through protists. Based on DeLong & Karl (2005). DeLong E and Karl D (2005) "Genomic perspectives in microbial oceanography". Nature , 437 : 336–342. doi : 10.1038/nature04157 .
 SVG
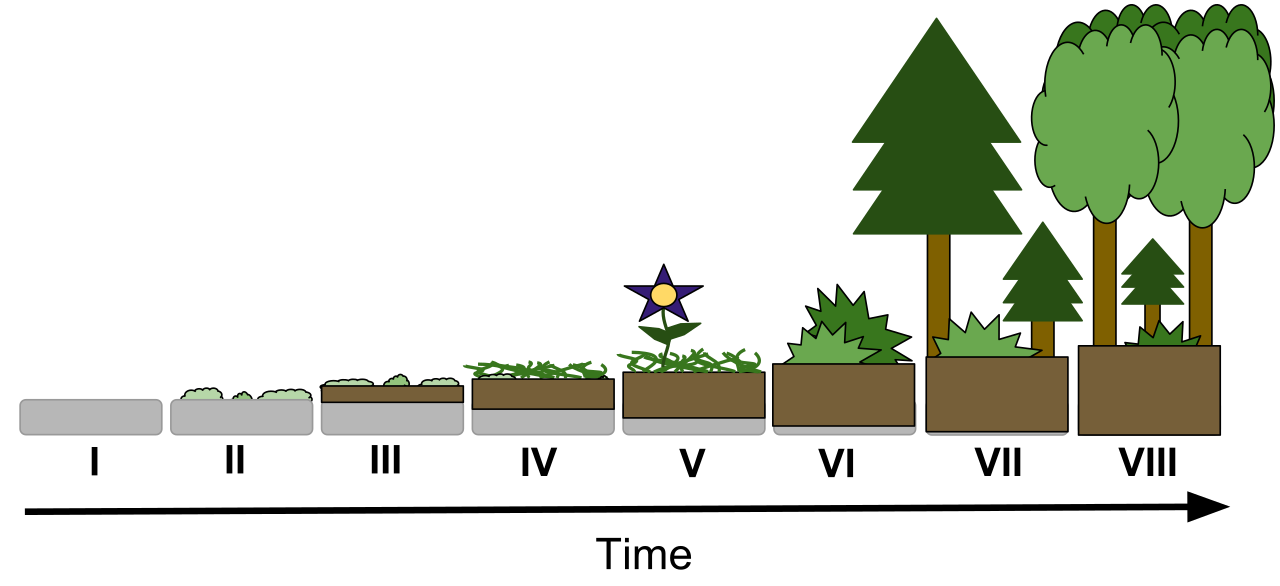
SVGAp Biology - Primary Succession
Primary succession is the process characterized by soil and organisms becoming established in an area lacking topsoil and vegetation. The process occurs in the following steps: I. The bare rock is exposed by glaciers or volcanic eruptions. II. Lichens and moss begin to grow on the rock. III. As the lichens and moss die, they decompose, which creates the first organic soil. The rock will slowly decay, and the soil depth will increase as the organisms in the following steps die and decompose. IV. The lichens and grass grow together. V. The grasses and small herbaceous plants thrive. VI. Shrubs and bushes appear in the deeper soil, which contains more water. VII. Smaller trees develop. VIII. Larger trees and shade tolerant plants dominate the landscape. The larger plant species contribute to a faster soil growth rate because of their leaves falling to the surface floor where they decompose. Not all plant species will survive in unison. As large plants grow, they compete for sunlight and nutrients creating unfavorable environments for shade intolerant organisms. Reference image: http://www.dna2life.com/environment/2-instances-primary-secondary-succession
 SVG
SVGAquatic Succession Or Hydrosere
Aquatic succession or hydrosere: A) Emergent plant life, or pond pioneers, surround an open water lake. Some terrestrial plant life surrounds it as well. B) Emergent plant life begins to move inward and submerge, filling up the lake. Sediment accumulates as the plants grow and die. Terrestrial plant life increases. C) Sediment fills the lake basin, leaving a swampy center at the surface. Terrestrial plants take over and begin to slowly dry out the damp surface.
 PNG
PNGLate Jurassic 150 Ma Koeppen Climate Types If Co2 1000 Ppmv 1 1 1 1
Evolutionary mechanisms and ecological trophic dynamics structure biodiversity across spatial and temporal scales.
 PNG
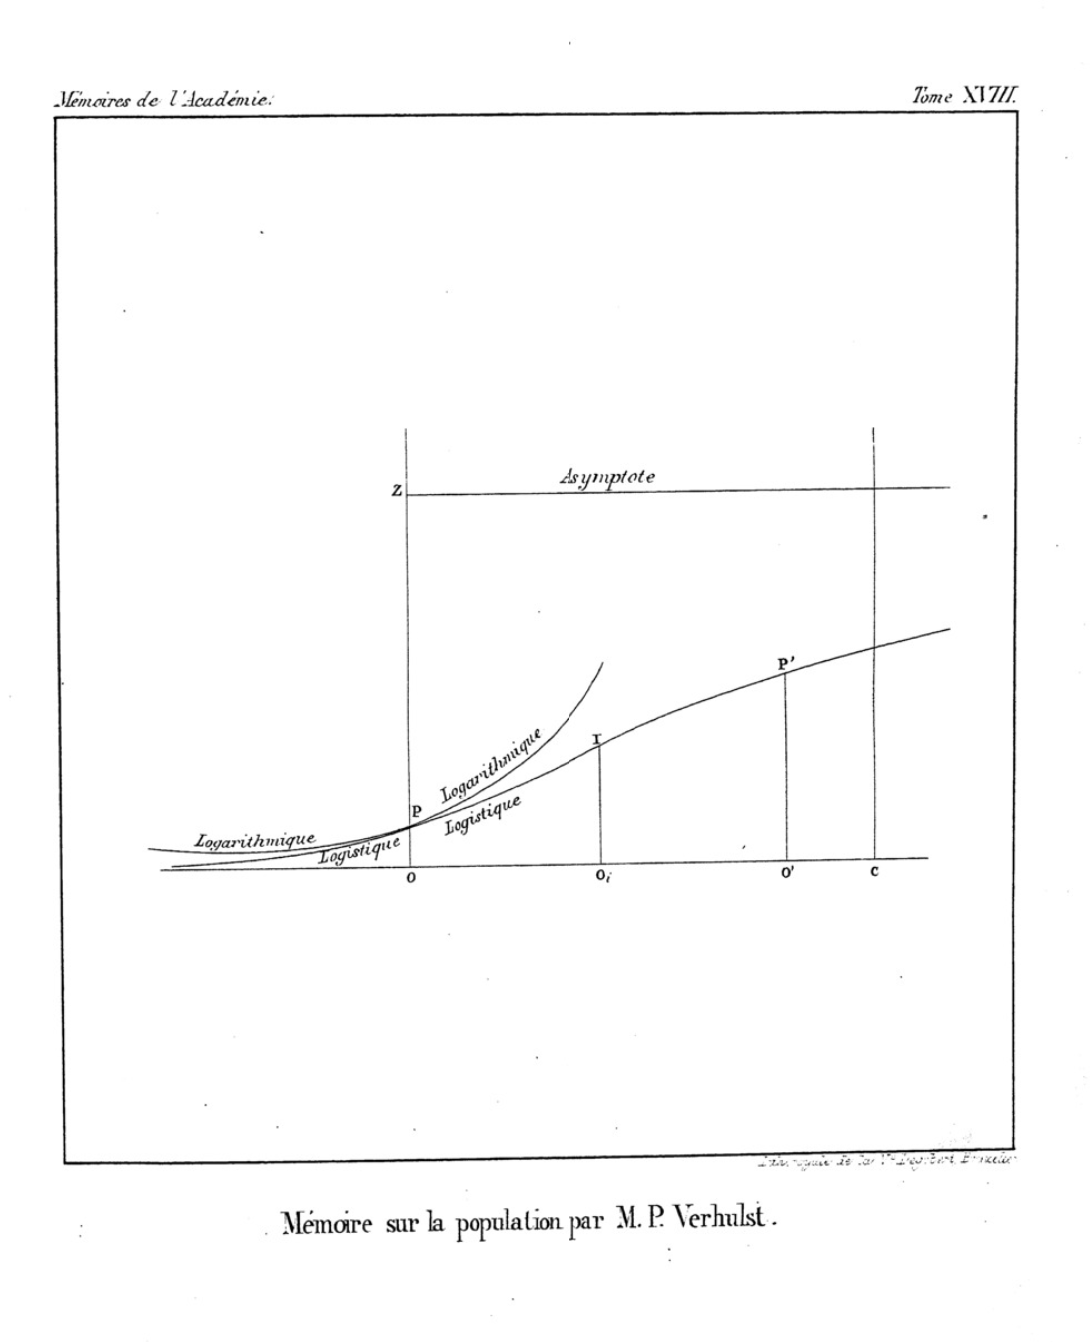
PNGCourbe Logistique, Verhulst, 1845
Figure introducing the logistic curve , and contrasting it with the "logarithmic curve" (in modern terms, exponential curve ), as a model of population growth.
 SVG
SVGGause'S Experiment And Fitted Logistic Curves
This figure shows Gause's experiment results [ 1 ] and logistic curves fitted with Levenberg-Marquardt Method. Logistic curve can be written as N = K 1 + ( K / N 0 − 1 ) e − r t . Below Scilab (lsqrsolve) code was used to fit the parameters (r, K, N 0 ). The fitted parameters of each curve are shown as follows: Saccharomyces cerevisiae : N 0 = 0.2831294, K = 12.742142, r = 0.2586369 Schizosaccharomyces kefir : N 0 = 0.4970908, K = 5.8802335, r = 0.0574421 Mixed population: N 0 = 0.3796836, K = 10.690843, r = 0.2116539 The population growth data used in this graph are derived from Table I of Gause's paper.