2.1 Light microscopy #
2.1.1 Magnification, resolution, and contrast #
Magnification makes an image larger. Resolution decides whether two nearby objects are seen as two. Empty magnification enlarges a blur.
The diffraction limit, in Abbe’s form, is about
d = λ / (2 NA)
where λ is the wavelength and NA is the numerical aperture of the lens, NA = n sin θ. Here n is the refractive index of the medium between the specimen and the lens, and θ is the half-angle of the cone of light the lens accepts. The Rayleigh criterion, 0.61 λ / NA, gives a similar number. For green light (about 500 nm) and a good oil-immersion lens (NA about 1.4), d is about 0.2 µm. Oil raises n above that of air, which is why the 100× objective is used with immersion oil and why a dry lens cannot match its resolution.
Contrast is the third requirement. Most cells are transparent. A perfect lens still shows nothing if the specimen does not change the light in a way the eye, or the camera, can detect. Stains create amplitude contrast. Phase contrast and differential interference contrast turn invisible phase shifts into intensity differences. Fluorescence creates contrast by collecting only the emitted colour.
2.1.2 Fixation and preparation for the light microscope #
Living cells can be watched with phase contrast or fluorescence, and that is the right choice whenever the question is movement, division, or transport. A fixed specimen is a snapshot, easier to stain and to store, and it can be false.
Chemical fixation cross-links or precipitates macromolecules. Formaldehyde and paraformaldehyde cross-link proteins and are standard for fluorescence. The cell dies, membranes become leaky to small molecules, and soluble proteins can be extracted or shifted unless the fixation is fast. Glutaraldehyde cross-links more tightly and is preferred for electron microscopy; it often destroys the epitopes that antibodies need, so it is a poor default for immunofluorescence.
A fixed cell that will be stained with an antibody to an internal protein usually has to be permeabilised, often with a mild detergent, so the antibody can cross the membrane. Permeabilisation extracts lipids. Interpreting a “membrane” pattern in such a specimen requires a control.
2.1.3 Bright-field and dark-field #
Bright-field microscopy sends light through the specimen into the objective. Unstained cells are nearly invisible. Stains such as haematoxylin (nuclei, blue-purple) and eosin (cytoplasm, pink) are the routine of histology. The image reports absorption. Resolution approaches the diffraction limit if the condenser is focused and its aperture is set properly; a stopped-down condenser increases contrast and lowers resolution.
Dark-field illumination arrives at the specimen from the sides, so steeply that direct light misses the objective. Only light scattered by the specimen is collected. The cell shines on a black background. The method shows thin bacteria, spirochaetes, and small particles that bright-field misses, including objects below the nominal resolution limit (they are detected, not resolved: a point still looks like a point).
2.1.4 Phase contrast and differential interference contrast #
A transparent cell slows light relative to the surrounding medium. The amplitude is almost unchanged, so bright-field shows nothing, but the phase of the wave has shifted.
Phase contrast (Zernike) separates the undeviated light from the light diffracted by the specimen and shifts their relative phase by about a quarter wavelength so that they interfere in the image plane. Dense regions, such as nuclei and organelles, appear dark or bright depending on the optical design. The method is the everyday way to watch live cultured cells. Its artifact is a bright halo around thick objects, which obscures edges.
Differential interference contrast (DIC), using Nomarski optics, splits polarised light into two close beams, lets the specimen shift their phase unequally, and recombines them. The image looks like a shadowed relief map. Contrast reports the gradient of optical path, not the thickness itself, so DIC is not a direct height measurement. It has little halo and optical sections thick specimens better than phase contrast. It is the method of choice for micromanipulation and for seeing chromosomes or unstained living protists.
2.1.5 Fluorescence microscopy #
A fluorescent molecule absorbs a photon and emits one of longer wavelength (the Stokes shift). The microscope uses an excitation filter, a dichroic mirror, and an emission filter so that the only light that should reach the detector is the emitted colour. Against a dark background, a few specifically labelled molecules are visible. This is the contrast method that made modern cell biology.
Labels are of three kinds.
- Small dyes. DAPI and Hoechst bind DNA and mark nuclei. Fluorescent phalloidin binds filamentous actin. Lipophilic dyes mark membranes.
- Antibodies. In direct immunofluorescence the fluorophore is on the primary antibody. In the indirect method a fluorescent secondary antibody binds the primary. The indirect method amplifies the signal and lets one secondary serve many primaries. Specificity is only as good as the antibody: a second method (a knockout, a second antibody, a different compartment marker) is needed before a localisation is trusted.
- Genetically encoded proteins, above all green fluorescent protein (GFP) from the jellyfish Aequorea victoria, and its spectral variants. The protein is fused to a cellular protein and expressed by the cell, so living cells can be filmed. Shimomura isolated the protein, Chalfie showed it works in other organisms, and Tsien built the colour palette.
Fluorescence has its own failures. Photobleaching destroys the fluorophore. Phototoxicity kills the cell, so long time-lapse experiments use low light. The emission is dim, and out-of-focus light from above and below the plane of interest fogs a conventional image of a thick cell. Confocal microscopy is the usual answer to that fog.
2.1.6 Confocal microscopy and the diffraction limit #
A confocal microscope scans a focused laser across the specimen and places a pinhole in the image plane in front of the detector. Light from the focal plane passes the pinhole. Light from other planes is rejected. The result is an optical section, and a stack of sections can be reconstructed into a three-dimensional view. Resolution in the focal plane is still diffraction-limited, roughly 0.2 µm laterally and worse (about 0.5 µm) along the optical axis.
Super-resolution methods go past that limit by changing the experiment, not by changing the wavelength. Stimulated emission depletion (STED) shrinks the emitting spot. Single-molecule localisation methods (PALM, STORM) find the centre of isolated fluorescent molecules with nanometre precision and build an image from many such localisations. They are part of current practice. They are not required to understand the classical methods, and they still depend on good labelling.
2.2 Electron microscopy #
2.2.1 Why electrons resolve more #
The wavelength of an electron in a transmission electron microscope, accelerated through tens or hundreds of kilovolts, is a few picometres. Diffraction therefore allows sub-nanometre resolution. Biological samples rarely reach the theoretical limit. Contrast, radiation damage, and specimen preparation set the practical limit, which for routine thin-section work is on the order of a nanometre, and for single-particle cryo-EM of a good specimen is now near atomic resolution.
Electrons interact strongly with matter, so the specimen must be thin and the column must be under vacuum. A living, hydrated cell cannot be examined by conventional EM. Every EM image is of a prepared specimen, and the preparation is part of the result.
2.2.2 Preparing a specimen #
The standard thin-section sequence is:
1. Primary fixation with glutaraldehyde, to cross-link proteins.
2. Secondary fixation and staining with osmium tetroxide, which binds unsaturated lipids and adds electron density to membranes. This is why membranes appear as dark lines.
3. Dehydration through a solvent series.
4. Infiltration and embedding in epoxy resin.
5. Sectioning on an ultramicrotome with a glass or diamond knife, at about 50–100 nm, so that electrons can pass.
6. Post-staining with uranyl acetate and lead citrate. Heavy metals scatter electrons; scattered electrons are removed by the objective aperture, so stained regions look dark on the screen. The image is a shadow of metal distribution, read as a map of the underlying structure.
Two alternatives answer different questions.
- Negative stain. A particle such as a virus or a ribosome is dried in a puddle of heavy-metal salt. The metal fills the crevices and the particle excludes it, so the particle appears light against a dark background. Fast, and limited to isolated particles.
- Freeze-fracture. Frozen membrane splits along the hydrophobic core of the bilayer. A metal replica of the fracture face shows intramembrane particles, which are membrane proteins. This was decisive evidence that proteins sit inside the bilayer, not only on its surface.
- Cryo-preparation. Rapid freezing traps water as vitreous (glass-like) ice rather than crystals. Cryo-EM images the hydrated specimen with no heavy-metal stain. It is the current route to molecular structures of complexes that will not crystallise.
Artifacts to name in an exam answer: extraction of soluble components, collapse of membranes, shrinkage during dehydration, and crystals of ice if freezing is slow.
2.2.3 TEM and SEM #
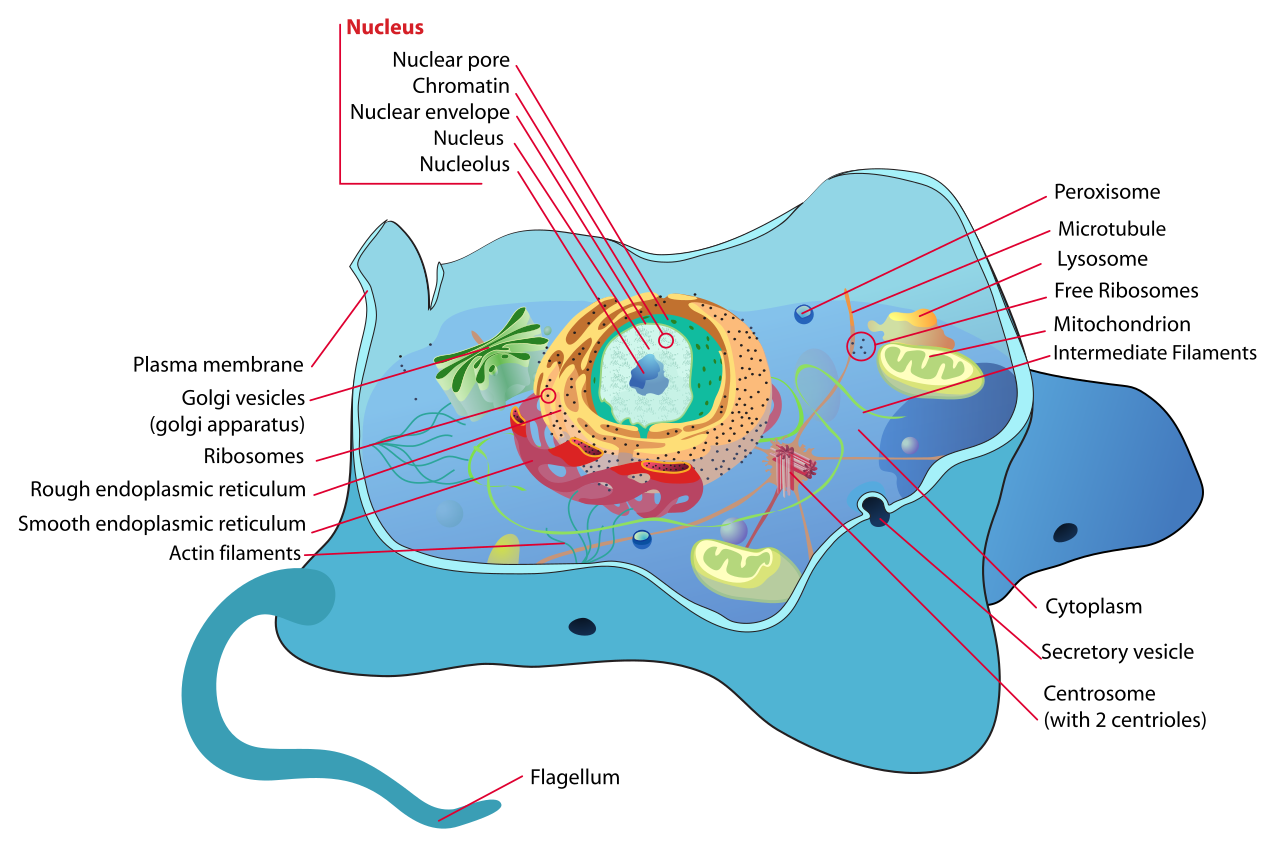
Transmission electron microscopy (TEM) passes electrons through the section. Lenses are electromagnetic. The image shows internal structure: the double nuclear envelope, cristae, the trilaminar appearance of the plasma membrane, ribosomes on the rough ER, and the coats on vesicles. Immuno-EM uses antibodies coupled to electron-dense gold particles of a chosen size, so a specific protein can be localised.
Scanning electron microscopy (SEM) scans a focused beam across a surface and collects secondary electrons knocked out of it. The specimen is dried and usually coated with a thin metal film so that charge does not build up. The image is a three-dimensional view of the surface: cilia, microvilli, the outside of a pollen grain, the shape of a cultured cell. Resolution is lower than in TEM, typically a few nanometres in a good instrument, and the interior is invisible unless the cell is broken open.
2.3 Centrifugation and cell fractionation #
The study of Centrifugation and cell fractionation provides fundamental principles governing cellular architecture, molecular interactions, and physiological regulation.

Fungus Cell Cycle
2.3.1 The principle #
A particle in a centrifuge experiences a centrifugal force proportional to its effective mass and to the square of the angular velocity. What actually decides how fast it moves is the balance of that force against buoyancy and viscous drag. Large, dense, compact particles pellet first. Small or low-density particles stay in the supernatant.
The relative centrifugal force, in multiples of gravity, is
RCF = 1.118 × 10⁻⁵ × r × (rpm)²
with r, the distance from the rotor axis to the particle, in centimetres. Quoting a speed in rpm without the rotor radius does not specify the force.
The sedimentation coefficient s is the velocity per unit of centrifugal field, measured in Svedberg units. One Svedberg (1S) is 10⁻¹³ seconds. It is a property of the particle in a stated solvent. “80S ribosome” means a sedimentation coefficient of 80 × 10⁻¹³ s under standard conditions. Svedberg units do not add: the 40S and 60S subunits together make an 80S ribosome, not a 100S ribosome, because shape changes on association.
2.3.2 The instrument #
A centrifuge is a rotor driven at controlled speed and temperature, inside an armoured chamber. Preparative rotors are of two main kinds.
- Fixed-angle rotors pellet particles quickly. The path to the wall is short.
- Swinging-bucket rotors let the tube swing out so that the gradient, and the bands in it, reorient along the axis of the force. They are used for density gradients.
Ultracentrifuges reach forces of several hundred thousand times gravity and need vacuum and refrigeration, because friction would otherwise heat the rotor and denature proteins. Analytical ultracentrifuges record the boundary of sedimenting material during the run and are used to measure s and to test whether a protein is a monomer or an oligomer.
Balance is a safety rule, not a courtesy. An unbalanced rotor at high speed destroys the instrument and can injure the operator. Infectious samples are capped because a spinning tube generates aerosols if it fails.
2.3.3 Differential centrifugation #
Differential centrifugation separates particles by how long they take to pellet at a given force. A tissue is homogenised in isotonic buffered sucrose so that organelles stay intact and do not clump. The homogenate is then spun at increasing force. Each pellet is resuspended and can be washed.
A typical animal-cell scheme:
| Step | Force and result | Enriched in |
|---|---|---|
| 1 | Low force, about 1,000 × g, 10 min | Nuclei, unbroken cells, debris |
| 2 | About 10,000–20,000 × g | Mitochondria, chloroplasts if present, lysosomes, peroxisomes |
| 3 | About 100,000 × g, 1 h | Microsomes (fragments of ER and Golgi and other small vesicles), plasma-membrane sheets |
| 4 | Supernatant of the last spin | Cytosol: soluble enzymes, inclusions that did not pellet |
The pellets are enriched, not pure. Lysosomes, mitochondria, and peroxisomes overlap at step 2 and are separated by a later gradient. Purity is checked with marker enzymes or marker proteins: cytochrome c oxidase for mitochondria, catalase for peroxisomes, acid phosphatase for lysosomes, lactate dehydrogenase for cytosol.
This scheme, developed by Claude, de Duve, and Palade, is how lysosomes and peroxisomes were discovered: as particles defined by their enzymes before they were firmly identified in the microscope.
2.3.4 Density-gradient centrifugation #
A gradient of sucrose, or of a denser salt such as caesium chloride, or of a colloidal medium such as Percoll, is formed in the tube. The sample is applied and the rotor started. Two experiments must not be confused.
- Rate-zonal separation is about speed. Particles move through the gradient at rates set by their sedimentation coefficients. The run is stopped while they are still moving. A small difference in s can be resolved. The particles must not be spun long enough to reach their buoyant density, or the separation collapses.
- Isopycnic separation is about density. The run continues until each particle sits at the position where its density equals the density of the gradient. Further spinning does not move it. DNA is often banded this way in caesium chloride. Organelles are banded in sucrose or Percoll. A rate difference is irrelevant at equilibrium; two particles of equal density co-band even if one is much larger.
2.3.5 Putting a fraction back under the microscope #
A biochemical fraction is anonymous until it is looked at. The classical workflow pellets a fraction, fixes it, and examines it by TEM. If the catalase-rich fraction consists of the single-membrane organelles previously seen in sections, the organelle and the enzyme have been identified with each other. Modern work adds immunoblots, proteomics, and fluorescent markers in the living cell. The logic is the same: a location claimed by one method is confirmed by a second method that has different artifacts.
2.4 Key terms, summary, and self-check #
Key terms. Numerical aperture; diffraction limit; phase contrast; DIC; Stokes shift; confocal pinhole; glutaraldehyde; osmium tetroxide; TEM; SEM; cryo-EM; RCF; Svedberg; differential centrifugation; rate-zonal; isopycnic; marker enzyme.
Summary. Resolution, not magnification, sets what a microscope can show, and contrast decides whether it shows anything. Live-cell methods (phase, DIC, GFP) report behaviour; fixed and sectioned specimens report fine structure at the cost of artifacts. Centrifugation separates organelles by size and density, and marker enzymes tell you which pellet you have.
Self-check.
1. Two lenses magnify 1,000×. One has NA 0.3 and the other NA 1.3. Which image can show more detail, and why?
2. Why do unstained cells show up in phase contrast and disappear in bright-field?
3. Why is the specimen for TEM cut to about 50–100 nm, and why do membranes look dark?
4. A pellet obtained at 15,000 × g contains both mitochondria and lysosomes. Which gradient method separates them, and what marker do you assay in each band?
5. Why are Svedberg units of ribosomal subunits not additive?