
 SVG
SVGAllopatric Speciation Caused By Topography
Allopatric speciation can result from elevational topography. Climatic changes can drive species into altitudinal zones, isolating populations. 1: Higher elevation peaks act as "islands" to promote speciation. 2: Lower elevation valleys act as "islands" to promote speciation.[1]
 SVG
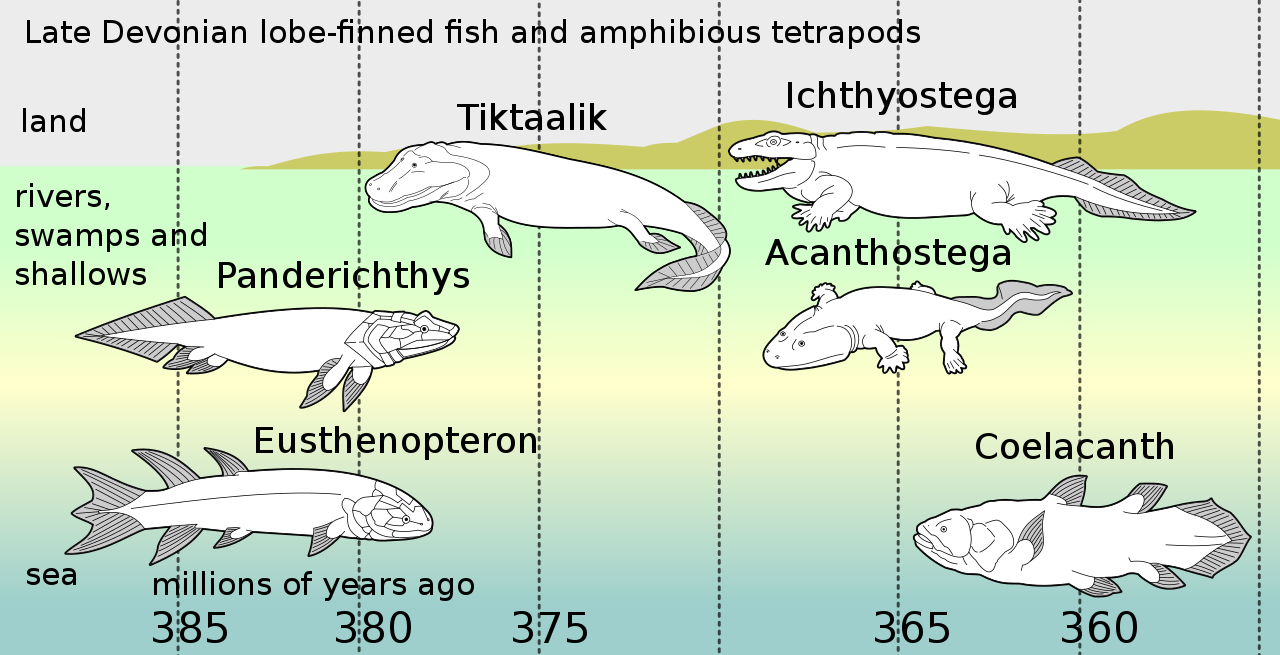
SVGFishapods
Evolutionary mechanisms and ecological trophic dynamics structure biodiversity across spatial and temporal scales.
 SVG
SVGGeologic Time Scale Spiral Ics Colours (Light) Path Text
The geologic time scale proportionally represented as a log-spiral. Some key events in Earth's history are marked on the diagram, including major extinction events, global scale glaciations, the initiation of permanent atmospheric oxygen, the formation of the moon, and the formation of Earth's magnetic field. The outer spiral arcs show components of the evolution of life on Earth. Ma=Megaannus (un
 SVG
SVGHomology Vertebrates
The principle of homology: The biological derivation relationship (shown by colors) of the various bones in the forelimbs of four vertebrates is known as homology and was one of Darwin’s arguments in favor of evolution.
 SVG
SVGPatterns Of Natural Selection
Diagram showing how allele frequencies can respond to natural selection (stabilizing, disruptive, and directional to either extreme).
 SVG
SVGSpeciation By Reinforcement Schematic
A simplified diagram of the process of reinforcement. Two incipient species evolve complete reproductive isolation due to selection rejecting unfit hybrids. Here, mate discrimination acts to reinforce the speciation process.
 SVG
SVGSympatric Speciation Schematic
A simplified diagram of sympatric speciation. Reproductive isolation evolves within a population without the aide of geographic barriers.
 SVG
SVGSpeciation Modes-He
Geographic illustration of SPATIAL ASPECTS OF SPECIATION: allopatric speciation - physical barrier divides population peripatric speciation - small founding population enters isolated niche parapatric speciation - new niche found adjacent to original one sympatric speciation - speciation occurs without physical separation See File:Speciation modes.svg for more details.
 SVG
SVGSpeciation Modes Ca
Geographic illustration of SPATIAL ASPECTS OF SPECIATION: 1. allopatric speciation - physical barrier divides population 2. peripatric speciation - small founding population enters isolated niche 3. parapatric speciation - new niche found adjacent to original one 4. sympatric speciation - speciation occurs without physical separation
 SVG
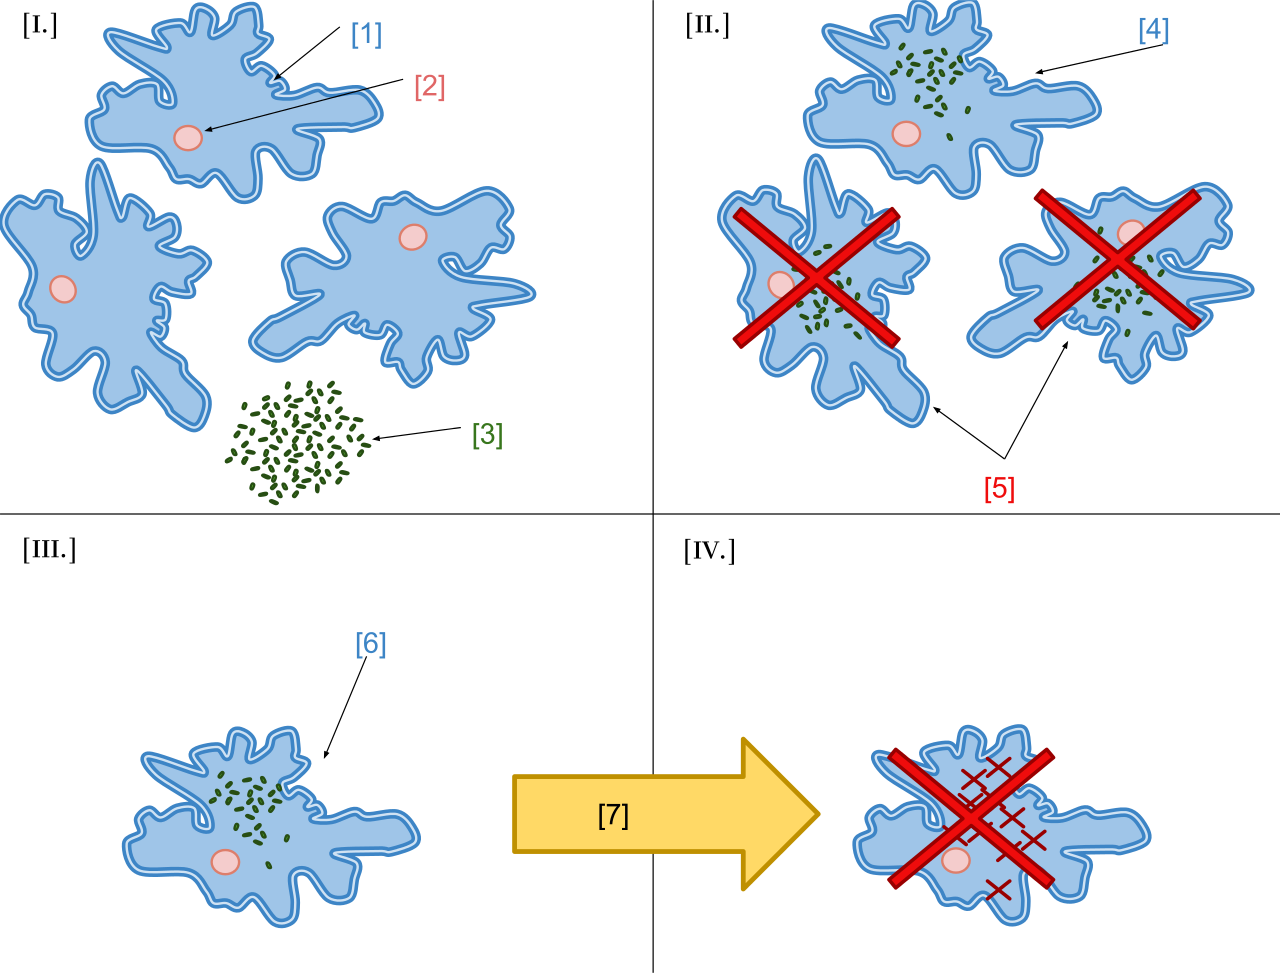
SVGJeon Experiment- Endosymbiotic Theory Evidence
In 1966 Microbiologist Kwang Jeon conducted an experiment with amoebae communities providing real-life evidence for the endosymbiotic theory. The single-celled amoebae community was infected by a bacterial infection of x-bacteria. The x-bacteria caused many of the amoebae to become sick and die. Very few of the amoebae survived the epidemic. Amoebae surviving the epidemic have x-bacteria living inside their cytoplasm. Antibiotics were used to kill the x-bacteria inside the remaining amoebae causing the host amoeba to die as well because the amoebae had become dependant on the x-bacteria to survive. Labels: [1] Amoebae, [2] Nucleos, [3] X-Bacteria , [4] Infected Amoebae, [5] Sick Amoebae, [6] Surviving Amoebae, [7] Add Antibiotic
 PNG
PNGEndosymbiotic Theory
Shown above, x-bacteria is infecting the amoeba cell. The cell does not recognize the bacteria and gets sick(this is replicated by change in size of the amoeba cell). Eventually the amoeba becomes dependent on the x-bacteria. The x-bacteria is shown leaving the amoeba cell and the cell becomes sick again. This diagram replicates the studies of microbiologist Kwang Jeon in 1966.
 SVG
SVGAllopatric Speciation Schematic
A simplified diagram of the process of allopatric speciation (vicariance). A species population becomes separated by a geographic barrier, whereby reproductive isolation evolves producing two separate species.
 SVG
SVGAllopatric Speciation With Reinforcement Schematic
A simplified diagram of the process of allopatric speciation with reinforcement after secondary contact. After a geographic barrier arises, two species evolve reproductive isolation. Here, the geographic barrier is removed before complete isolation, whereby the two populations exchange genes. Low fitness hybrids may form, but reinforcement (effectively a process of mate choice discrimination) causes the completion of the speciation process.
 SVG
SVGDe Finetti
A De Finetti diagram illustrating the Wahlund effect. Genotype frequencies are given by the edge distances x (for AA), y (Aa) and z (aa). Allele frequencies p and q = 1 - p are determined by the horizontal displacement along the bottom edge connecting aa and AA, scaled by constant factor (1/2)sqrt(3) (the ratio between the height and the base of an equilateral triangle). Also p = x + y/2 and q = y/2 + z. The curved line are the Hardy–Weinberg equilibrium genotype frequencies; points 1 and 2 denote two populations in equilibrium. The genotype frequencies of the combined population are a weighted mean of the subpopulation frequencies, corresponding to a point somewhere on the solid line connecting 1 and 2. This point always has a lower heterozygosity (y value) than the corresponding (in allele frequency p) Hardy-Weinberg equilibrium.
 PNG
PNGGeneriskcalc A Web-Based Tool For Genetic Risk Association Analysis In Case-Control Studies
Workflow diagram of GeneRiskCalc from input to visualization: The process includes user data entry, Hardy–Weinberg Equilibrium testing, Odds Ratio calculation, and optional forest plot generation for result visualization